
For this month’s T-SQL Tuesday, Brent Ozar (blog|Instagram) asks us to describe the most recent ticket we closed.
“We had a pretty significant wait spike…”
The literal last ticket I closed was “please run this script in production…”, and I don’t think it would be a very interesting blog post to talk about how I copy & pasted a query into SSMS, so let’s talk about a recent ticket instead, from the last couple of weeks.
In January, one of our Staff Engineers sent the following message to the DBRE help channel in Slack:
Morning folks, we had a pretty significant wait spike on the [database]. Circuit breakers closed and reopened quickly. Is anyone immediately aware of a reason why this could’ve happened?
I responded (“Taking a look… 👀”), and dove into our monitoring metrics. It took me about 15 minutes to determine what had happened. As I investigated, I dropped my findings into the Slack thread. These are “almost quotes” from that thread, edited for clarity & so I can share externally:
- Looks like an
INSERTwas slow, which caused about 3 seconds of blocking. - There was some convoying as the
INSERTblocked other queries, which blocked other queries, which blocked other queries, so once it was unblocked, it took a hot second for it all to clear up. - Looking to see if it was just something transient or if there’s more to it.
- The initial slow insert was blocked by a data purge process doing a delete. Both the insert and the delete blocked a bunch of things.
- I don’t think this is the data purge per se. I’m seeing a small impact every 5 minutes when the log backup runs during the data purge. Something about the combination. I’ll create a ticket to investigate & resolve it.
Rebel without a cause
I had zeroed in on the problem, but I didn’t quite have “root cause” since I didn’t have enough info to fix it yet. Fast forward to a few days later when I picked up that ticket I had created…
Looking at the IOPS for the database in question, I saw that IOPS were spiking on the cadence of the log backups:
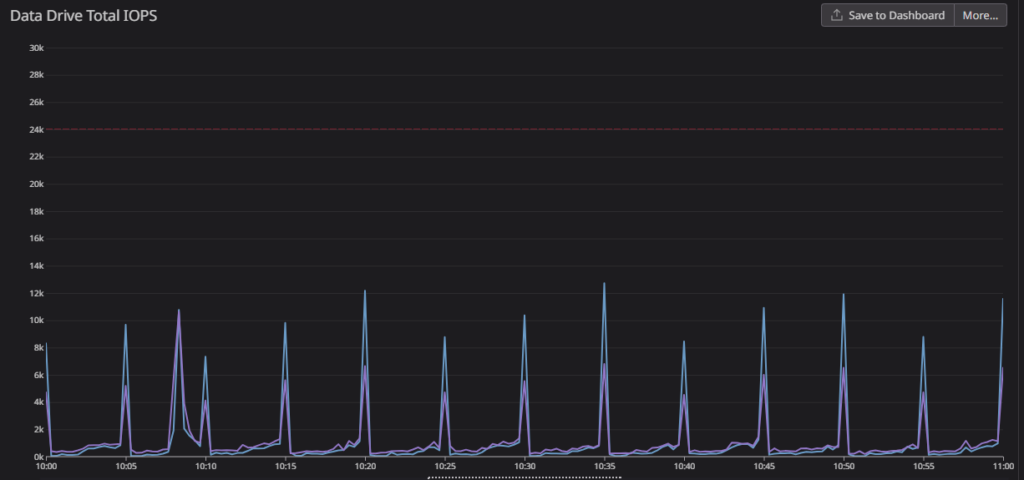
The interesting thing, and the key to the root cause, was that the data and log files were BOTH spiking in IO. Log backups by themselves would only be reading from the log file. So why is the data file spiking too?
CHECKPOINTS!
When SQL Server backs up the transaction log, it also clears the portion of the log for reuse (assuming nothing else also needs the log). In order to do that, SQL Server implicitly CHECKPOINTs the database to push dirty pages to disk, and ensure the log won’t be needed for redo or crash recovery.
We already have indirect checkpoints enabled, and this server is running SQL Server 2016, so Accelerated Database Recovery (ADR) isn’t an option.
The data purge process is chewing through and deleting a lot of data. It follows all of my own best practices for deleting data (batches, waits, efficient plans), and everything is configured properly, but because it’s all being pushed to disk at once–at the same time we’re reading the transaction log for backups–it’s really beating up on the disk.
I was going down a wormhole of thinking about how to throttle the data purge, when I mentioned it to Erik Darling (blog|YouTube). Erik helped me see the forest through the trees and said “Why not just add manual checkpoints to make sure they happen more often?” Ugh. I hate when Erik is right.
The Fix
Erik & I looked at the purge code and sorted out a proper fix.
The purge deletes from a number of tables, and already handled tracking the number of rows deleted. After each delete, it saves the stats to a temp table:
        INSERT INTO #Log (TableName, LogDatetime, RowsDeleted)
        VALUES('dbo.Whatever',GETDATE(),@@ROWCOUNT);
And at the very, very end of the cleanup, I summarize the rows deleted into a persisted table:
        INSERT INTO dataretention.CleanupLog (TableName, LogDatetime, RowsDeleted)
        SELECT TableName, MAX(LogDatetime), SUM(RowsDeleted)
        FROM #Log
        GROUP BY TableName;
To ensure we get “frequent enough” checkpoints (quotes, because in database optimization, “good enough” is the goal, not “best”), we wanted to make sure CHECKPOINTs happened about 4x more often. We decided to control this both by looking at the volume of deleted data, and based on time. It was trivial to use the temp table to measure data volume, then we just added a variable declared as @LastCheckpoint datetime2(0) = GETDATE();.
Finally, at the end of each delete loop, we added this conditional checkpoint:
        --Commit every ~60 seconds, or 50k deleted rows. Whichever comes first
        IF (
            (DATEDIFF(SECOND,@LastCheckpoint,GETDATE()) > 60)
              OR
           (SELECT SUM(l.RowsDeleted)
            FROM #Log AS l
            WHERE l.LogDatetime >= @LastCheckpoint
            ) > 50000 /*Or some other magic number*/
          )
        BEGIN
            CHECKPOINT;
            SET @LastCheckpoint = GETDATE(); --Keep track of when
        END;
💥Boom💥 Problem solved
Once the code change made it to production, the data purge job ran smoothly, and all those nasty IO spikes (and the impact to user-facing processes) disappeared.
The fix was easy, once we dug deep enough. I knew that I needed to keep digging until I figured out why the data purge & log backup were causing slowness. And I also knew to talk out the solution with my teammates and friends. I wouldn’t have come to this solution on my own–at least not quickly.
So remember–when you’re trying to solve a problem “forever”….
- Make sure that you really find the root cause so you can understand why the problem is happening.
- Don’t try to solve it by yourself. Ask your teammates. Ask your friends. Read a blog post. Someone else might already have an answer.
Thanks for the post, sir!
I too hate it when Erik is right, but it’s better all round if we admit it. Great write-up.