During the course of normal processing in a database, blocking happens. Blocking is “by design” because your database is on ACID. In an OLTP database, most of your transactions are short in duration, so we expect blocking to also be short in duration. If blocking occurs for a long time, this can cause problems.
Blocking Bad
When blocking goes bad, it can go really bad. Sometimes it’s because someone (usually, that someone is me) forgets to commit a transaction before going to lunch, and those open locks cause a bunch of blocking. Sometimes a data load runs at a strange time, or an unusual amount of data gets loaded, or a query gets a bad plan and starts running long, or… you get the idea. There are a bunch of reasons this can come up.
The hardest part is that sometimes big blocking chains build up. The session I forgot to commit blocks 5 session. Each of those block 5 sessions. Each of those block 5 sessions… Eventually, I have 8000 sessions waiting on me, and I’m off eating a kale & farro salad. Oops.
Good thing the Junior DBA is at his desk
While I am eating my salad, the application suddenly stops working. Thankfully, the Junior DBA is at his desk and springs into action. He remembers that sys.dm_exec_requests shows who is blocking, so he queries the DMV to find out who is causing the blocking:
SELECT *
FROM sys.dm_exec_requests
WHERE blocking_session_id <> 0;
Now he’s looking at thousands of blocked sessions with hundreds of blocking spids. How does he find the one leading blocker at the front of the line? There are a few options.
Who is (in)active?
Since you probably have sp_WhoIsActive installed on your server, you could use this to find the leading blocker. sp_WhoIsActive, has a @find_block_leaders parameter that helps you find the leading blocker:
EXEC sp_WhoIsActive @find_block_leaders = 1;

This works. The junior DBA can see that session 58 is the leading blocker, kill my session and get the application back running. I can finish my lunch without getting a panicked call. Awesome.

I want more
I love sp_WhoIsActive for seeing what’s going on. It’s an incredible general-purpose Swiss Army knife. The thing with a Swiss Army knife is that the scissors work great at trimming a loose string, but if you’re doing a craft project, you want something purpose built for the job.
Over the years, I’ve had scenarios where I need to get to the bottom of complicated blocking scenarios, and I need to figure it out fast. I need to solve the immediate problem by killing a blocker, and I need to gather information about exactly what was running so that I can prevent it from happening again.
Those scenarios led me to create a custom-purpose tool to help find the details of blocking in my database. Here are my requirements:
- A filter to ignore shorter-duration blocking
- The leading blocker(s) are blatantly obvious
- Easy to see the full chain of sessions involved in blocking
- Info on the
- object(s) involved in blocking
- statement(s) involved in blocking
- person, session, and application involved in blocking
- Quick to run, get info, save it to debrief later, and then resolve the blocking.
dbo.Check_Blocking
I create a DBA database on every server I manage. It contains all my utility scripts and open source code (like the First Responder Kit). In it, I created a stored procedure that I can use to identify blocking, and achieve the above goals. Behold: dbo.Check_Blocking.
When I have blocking on a server, I just run EXEC DBA.dbo.Check_Blocking and I get all the info I need. By default, it filters out blocking shorter than 5 seconds (you can control this with the @BlockingDurationThreshold parameter). If I need to kill some sessions, I open a new window and kill them–saving the output from Check_Blocking in the original window. I can go back and examine the details later.
UPDATE 2017-12-17: I’ve added a new filter to
dbo.Check_Blocking. You can now use the@BlockedSessionThreshold, parameter to filter based on the number of blocked sessions. For example,EXEC DBA.dbo.Check_Blocking @BlockedSessionThreshold = 10;will only show blocking chains with at least 10 blocked session waiting on the leading blocker. I was already identifyingBlockedSpidCounton the Leading Blockers–now I also let you filter on that field. Note that *both* result set are filtered when using this parameter. Also, on first pass, I’ve made it so that you can only filter on blocking duration or number of blocked sessions. It seems to work with both, but the number of test cases was more than I wanted to test.
Let’s look at the output
Here’s an example where there is a bunch of blocking. (Yes, I use “spid” instead of “session_id” in the column titles. Sue me.)

There are four separate chains of blocking, and therefore four leading blockers. The first result set shows all four of the leading blockers, and all the session info about them. The second column (BlockedSpidCount) tells me how many sessions are being blocked by this session. Notice session 58 is causing more blocking than others? Notice how easy it is to see?
Now look down at the second result set. The first four columns contain a bunch of session_ids.
WaitingSpid is the session_id of the blocked session.
BlockingSpid is the session that is directly blocking the WaitingSpid–think of this as the next person in front of you in line.
LeadingBlocker is the person at the front of the line causing all the problems, and corresponds to one of the rows in the first result set.
BlockingChain is my favorite part. This shows you the full list of sessions involved in the blocking. In a rat’s nest of complicated blocking, this column can make it really easy to step through what actually happened.
ProgramName will not only show the program name passed in the connection string–but it also does some additional work for SQL Agent jobs. Have you ever noticed that in sys.dm_exec_sessions and sys.sysprocesses, SQL Agent jobs show the JobID GUID instead of the job name? Well, I decode that GUID and replace it with the proper job name.
What objects were locked?
If we scroll to the right of the second result set, we can see details on exactly what was being blocked:

We see the command that was blocked (Were you trying to do an INSERT? a SELECT? CREATE TABLE?), how long it was blocked (in milliseconds), and the details on what we’re waiting on. If you query sys.dm_exec_requests, you can get the wait_resource, which has a coded mess of ID values that correspond to an object in the database. I can never remember how to decode that into an actual object name, so Check_Blocking does it for me and shows it in the WaitDescripiton column.
Now, when I am trying to do a root-cause analysis, I can have the info on where locks were being held. Perfect!
But what SQL was running?
There are a few different answers to this, and they are all correct.
- You can look at
DBCC INPUTBUFFERto find the most recent batch that was sent to the session. - You can look at
sys.dm_exec_requestsandsys.dm_exec_sql_textto get the full text of the procedure that is being run. - You can decode the results from
sys.dm_exec_requestsandsys.dm_exec_sql_textto get the specific statement within that procedure that was running.
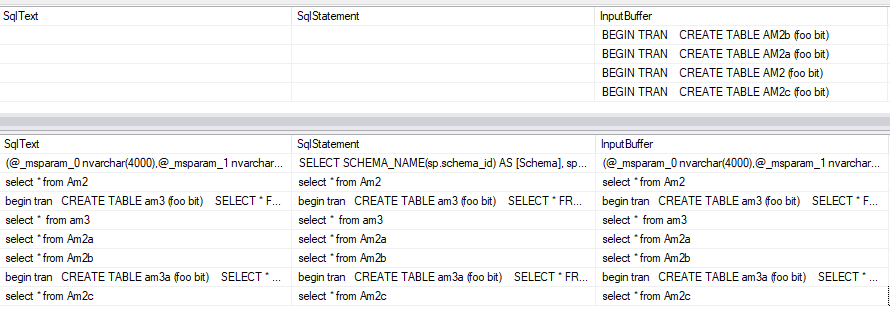
Sometimes, you want to look at all three:

I include all three flavors of “what SQL is running”. Note that if the SqlText/SqlStatement are blank, it means that session is idle, and it’s not currently running any SQL statement at the time. It’s also important to note that this will show you the statement/batch that is currently or most recently running. For the blocking session, this might not be the statement that took the locks that are causing blocking. The blocking session is running and doing work–it might have moved on to another batch while holding an open transaction.
But wait, there’s more
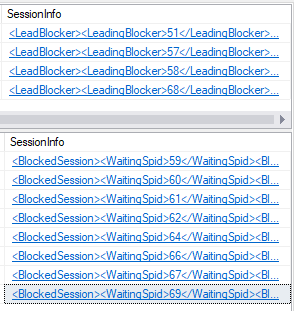
The last column of both result sets is a chunk of XML:

The XML doesn’t contain anything special. It just packages up the other columns a into a bite-size chunk:
This file contains hidden or bidirectional Unicode text that may be interpreted or compiled differently than what appears below. To review, open the file in an editor that reveals hidden Unicode characters.
Learn more about bidirectional Unicode characters
| <BlockedSession> | |
| <WaitingSpid> 67 </WaitingSpid> | |
| <BlockingChain> 67 » 64 » 57 </BlockingChain> | |
| <LoginName> AMallon </LoginName> | |
| <TransactionCnt> 0 </TransactionCnt> | |
| <WaitResource> OBJECT WAIT: master.dbo.AM2a </WaitResource> | |
| <HostName> AMALLON-LT </HostName> | |
| <DbName> master </DbName> | |
| <LastRequest> 2017-10-26 22:49:58 </LastRequest> | |
| <ProgramName> Microsoft SQL Server Management Studio – Query </ProgramName> | |
| <InputBuffer> | |
| begin tran | |
| CREATE TABLE am3a (foo bit); | |
| SELECT * FROM am2a; | |
| </InputBuffer> | |
| <SqlStatement> | |
| begin tran | |
| CREATE TABLE am3a (foo bit); | |
| SELECT * FROM am2a; | |
| </SqlStatement> | |
| <SqlText> | |
| begin tran | |
| CREATE TABLE am3a (foo bit); | |
| SELECT * FROM am2a; | |
| </SqlText> | |
| </BlockedSession> |
This XML chunk is part of my plan of how I can save results as part of root-cause analysis. I can copy a cell, or the entire column, paste it into OneNote, and have everything I need to get to the bottom of things. In my blocking example, that might mean slapping someone on the wrist for leaving a transaction uncommitted. In another scenario, it might mean tuning code to be faster, or changing the code around so transactions are more atomic and quicker. Regardless, you can’t find the cause unless you have the info.
What are you waiting for?
Go download Check_Blocking, install it in your DBA database, and give it a shot.
True story: I once saw a process monitoring table with “spid_id” as a column name.
Did the spid_id refer to the spid table, where you can look up the spid based on spid_id?
Excuse me, it was tbl_spid
Hello! I’m getting this message:
DBCC execution completed. If DBCC printed error messages, contact your system administrator.
DBCC execution completed. If DBCC printed error messages, contact your system administrator.
Msg 9420, Level 16, State 1, Procedure Check_Blocking, Line 340
XML parsing: line 1, character 393, illegal xml character
I would really appreciate your help! Thank you very much for the script.
I ran into this recently, but I failed to grab enough details to get to the bottom of it. Collapse a bunch of columns into the one XML detail, and I suspect I need to add escaping for something. If you’re able to reproduce the problem, that would be a huge help! If not, I’ll keep digging.
I have the script on a production server. Yesterday we had block problems but not today. I’ll try to recreate the error. Thank you very much for your time!
Hi, Andy!
I was finally able to find the cause of the error. At certain times I have from 6 to 9 locks in exactly the same second. When I try to identify the Leader Block I get the error displayed.
Is there any way to modify the Script to get the leading lock despite having so many locks at the same time?
Thanks!
Hi Andy,
Any new version supporting Azure SQL Databases?
Thanks!
Hi Luis– I haven’t experimented with this on Azure SQL DB. If you experiment with making it work, you should submit a Pull Request on GitHub with your changes!