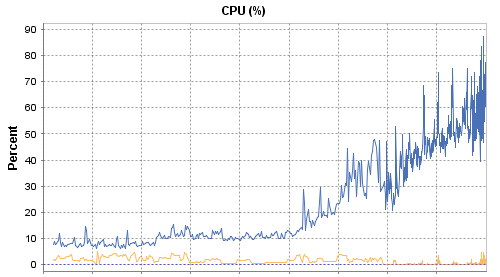
This week at work, I noticed CPU on one server seemed pretty high. I wasn’t familiar with this particular server, but based on the applications it supported, I was expecting the server to be under-utilized. I went over to vCenter to look at historical CPU performance, and see if high CPU was normal. When I looked at 30-day CPU usage, what I saw was alarming:

About two weeks ago, CPU started to slowly march up, and wasn’t stopping. It looks like CPU is going to hit 100%, right in the middle of the weekend. I like weekends. I don’t like working on weekends.
This should be easy
A 6x increase in CPU should be easy to track down. It’s going to stand out like a sore thumb. Should just be a couple minutes to track down.

I figured I’d just query sys.dm_exec_query_stats, and take a quick look at the cumulative CPU usage. Surely, whatever was causing the problem would be right at the top of the results:
SELECT TOP 100 db_name(t.dbid) AS DbName,
    object_name(t.objectid,t.dbid) AS ObjectName,
    t.text,
    SUBSTRING(t.text, (r.statement_start_offset/2)+1, (
            (CASE r.statement_end_offset
               WHEN -1 THEN DATALENGTH(t.text)
               ELSE r.statement_end_offset
             END - r.statement_start_offset)
          /2) + 1) AS SqlStatement,
	r.execution_count,
	r.total_worker_time,
	r.total_worker_time/r.execution_count AS avg_worker_time,
	r.total_logical_reads,
	r.total_logical_reads/r.execution_count AS avg_logical_reads
FROM sys.dm_exec_query_stats r
CROSS APPLY sys.dm_exec_sql_text(r.sql_handle) t
ORDER BY r.execution_count DESC;
Except…it wasn’t. Nothing at the top of the list explained the exorbitant CPU usage. I looked at the similar sys.dm_exec_procedure_stats DMV, and came up similarly empty handed. I started to poke around in SQL Sentry looking for expensive things. Nothing stood out. Why wasn’t I finding a smoking gun?? Finally, I said to myself “Andy, you’re an idiot. It’s running right now. Look at what is running right now.”
What’s running right now?
EXEC sp_WhoIsActive;
I ran sp_WhoIsActive a few times in a row. Each time, the results included only a few rows, but it looked like the same query every time. Also, the duration was always very fast: under half a second.

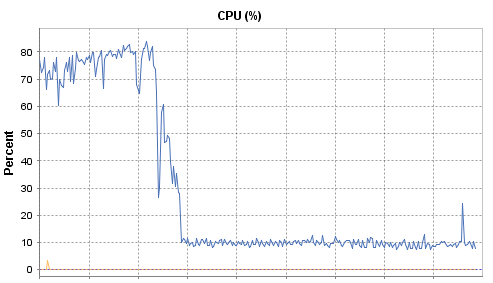
I was able to infer that something was running this very fast query very often. I had my smoking gun. Once I found the right tool, I had the answer in seconds. Fast-forward about an hour, and CPU was back to normal.

A ton of feathers still weighs a ton
This is a classic example how a single query can be “very fast” but because it is running millions of times, it can bring the server to it’s breaking point. If you have this situation, you have three main options:
- Make the query even faster. If this query has to run a million times every day, then half a second isn’t fast enough. It needs to run an order of magnitude faster.
- Make the query run less often. Do you really need to run the query a million times? Maybe…but for most people, the answer is probably not. (This was the solution in my scenario. In fact, this should probably be #1 because this is likely the right answer for you, too.)
- More CPU. I hate throwing hardware at an issue. But if your query can’t run faster, and it can’t run less often, then you might just need more horsepower.
But wait, there’s more!
The same query is running a million times per day, and causing all this CPU usage. Why wasn’t that showing up in sys.dm_exec_query_stats? My first query should have found it…Except it wasn’t the same query running every time.

This code is coming from an ORM, which is parameterizing the filters, but not the (unnecessary & arbitrary) TOP value. The DMVs all viewed these are separate queries, so it was not aggregating the stats. It also wasn’t reusing the plan (thus chewing up even more CPU from frequent compiles). If the TOP had not been there, or it had been passed as a parameter, my initial query of sys.dm_exec_query_stats should have found it.
“A ton of feathers still weighs a ton”. Well said. I like the sensible options (1, 2, & 3) for dealing with that situation. I had a similar one and was able to convince the developers to work the option #2 angle. In our case, it was successful too.
Great post!
I like the post and the way it’s crafted.
nice one Andy, thanks for sharing.
Nice forensics. Death by 1000 cuts. I’ve seen this pattern before and the developers complaining about the “SQL Server slowness. Must be fragmentation or blocking. Why does SQL Server do this?” Good grief.
I once spent two weeks optimizing a stored procedure that took 0.05 seconds to run. When I was done, it cut almost 50% off of the CPU. During batch processing that procedure was called 21 million times in an hour (luckily no table access).