Today, SQL Sentry announced the release of Plan Explorer 3.0. There are a few big changes, so let’s dive right in.
Plan Explorer just got free-er
 Up until now, Plan Explorer was essentially a freemium product. There was the free edition (which was really awesome), or you could upgrade to Pro edition for some extra features (making it awesomer). With this release, everything is now included in a single edition, and it’s all 100% free. Any feature that used to be Pro-only is now free. Multiple tabs, session history, opening deadlock files–free, free, free. Any new features? You guessed it–free.
It’s so free, you don’t even need to register or provide an email address to download it. I’m guessing you don’t like the “registration required” model because of the endless spam & sales calls. SQL Sentry doesn’t do that–they just want to help you make your queries go faster.
New icon, new logo
The first thing you’ll notice after you install version 3.0 is that there’s a new icon & new logo. The overall look & feel of the application is still the same, but you’ll notice a new icon on the Start Menu, and a new logo Plan Explorer’s Start Page. This isn’t exactly a functional change, but it’s certainly a sign that this is a major release of Plan Explorer.

New functionality
Index Analysis
You might have seen this feature in SQL Sentry v10, but it’s brand new to Plan Explorer.
When I’m tuning a query, I spend a lot of time going back-and-forth looking at the query, the plan, and existing indexes (including indexes not used by the current plan). I’m constantly trying to answer the same questions: Is the query using the best index? Do I need to modify an existing index? Do I need to add a new index?
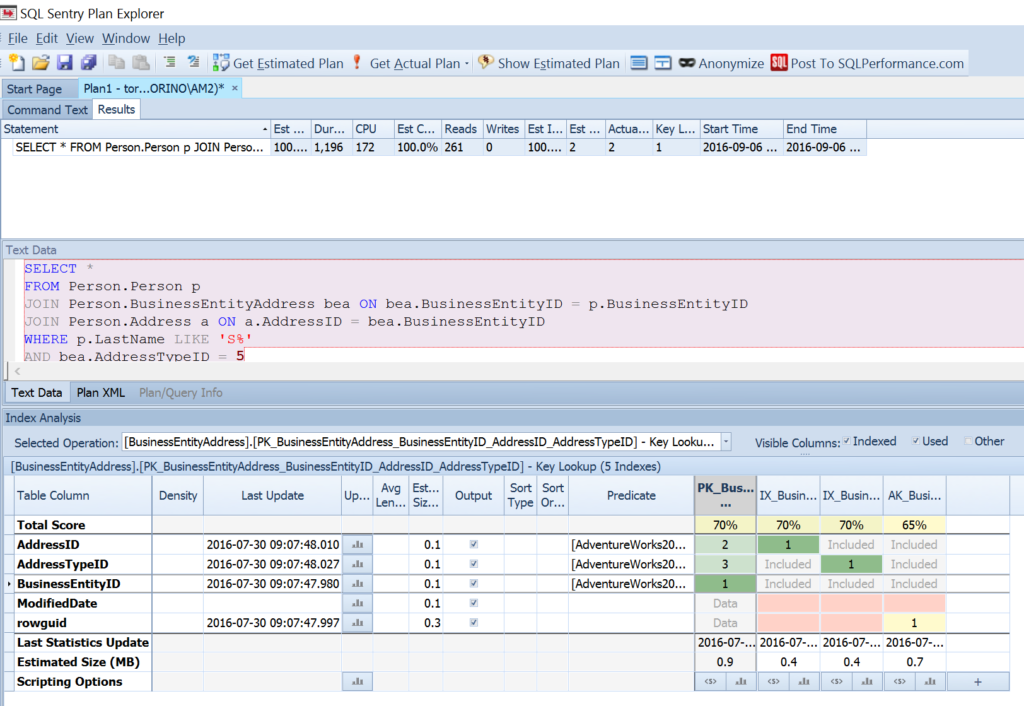
The Index Analysis feature helps answer these questions–all in one spot. There’s a lot more in this feature than I can cover in today’s blog post. I’ll let a screenshot do most of the talking. In one screen, I can see the performance metrics, the statement, and the index information. The index information includes index definitions, and how they relate to specific operators. You can even play around with possible new indexes you might add.
I’m looking forward to playing with this more, and digging into all the data & features on this screen. I haven’t used it much yet myself, but there are so many possibilities of how I will use it in the future.

Performance Profiling

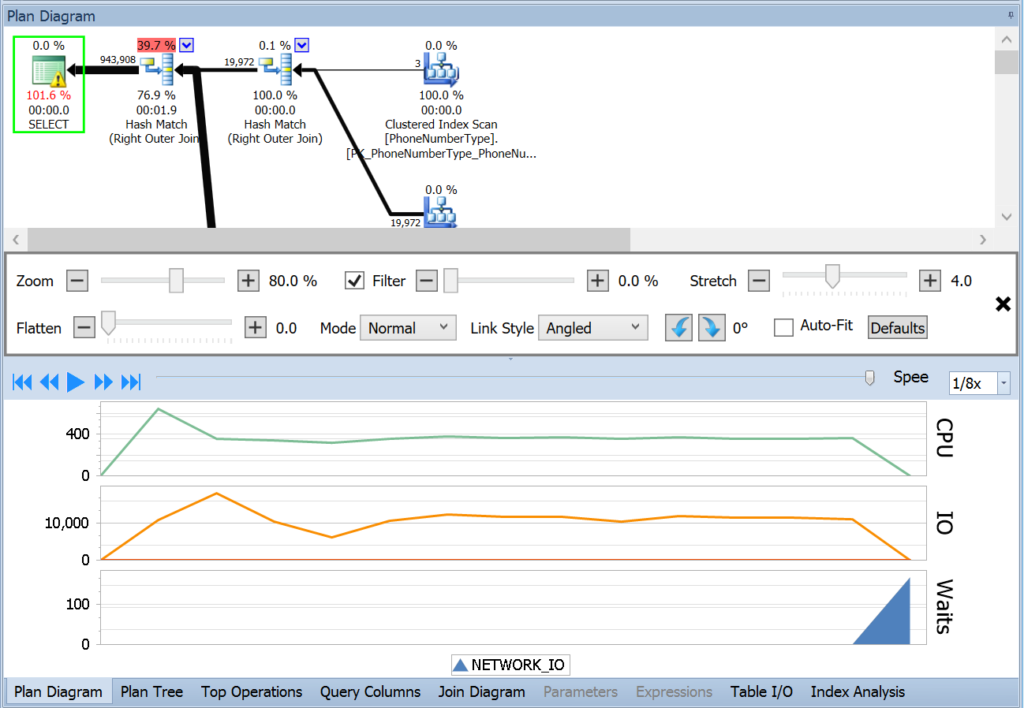
If you’ve used Live Query Profile in Plan Explorer (or Live Query Statistics in SSMS), then you’re familiar with seeing your query plan play live as it executes. Performance Profiling adds some special sauce to that feature. Its like a DVR for the live query profile, and also displays the performance metrics as a graph below the plan diagram. The graph gives performance metrics by time, rather than by operator. In complex plans, you might have many operators doing work at the same time, and you’ll be able to see that better by looking at the graphs. Adding a time axis to the plan is a pretty ingenious way to give a new way to look at performance.
You can then replay the “DVRed” query, and re-watch the profile without re-running the query. If you save the plan as a .pesession file, the DVR’ed query with performance profile is included in that file. You can even change the speed to watch in slow-mo or fast-forward.
I can pause, rewind, and fast-forward a query plan to have another way to really hone in on the most expensive part of the plan. Even better, I can ask developers to capture the Live Profile and Performance Profile for long running queries–so I can play it at 4x speed without running the actual query.
Replaying the execution plan at 16x speed might not count as “making the query run faster,” but it’s really fun to think that there is literally a “go faster” button.

Learn more
Aaron Bertrand (blog|twitter) hosted a webinar to review the new features in this release of Plan Explorer. You can watch the recording of that webinar on SentryOne’s YouTube channel.
The best way to learn something is to use it. Download the latest version of Plan Explorer, grab your favorite query, and take it for a spin.